An analysis of the UK COVID-19 data
UK is now the epicentre of the coronavirus in Europe as the virus deaths begin to peak and hopefully plateau. As of 17thApril 2020 the total COVID-19 cases in the UK were 114, 217 with the total COVID-19 hospital deaths numbering 15,464 – this represents a crude death rate of 14% in the UK which is disturbingly high.
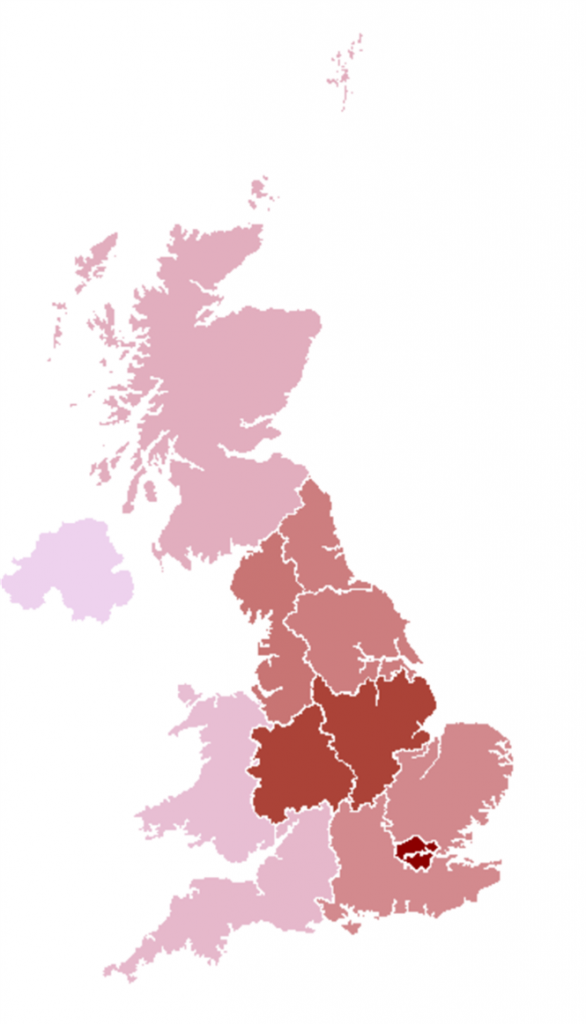
UK COVID-19 heat map
Let’s take a closer look at a UK COVID-19 heat map. The heat map shows total deaths across the UK as at 17th April 2020. The darker the red colour the higher the number of deaths (as a proportion of the population). London has the darkest hue of red in the heat map because this is where the virus has caused the most damage. Outside London the Midlands have the highest virus-related deaths.
Data Source: UK Public health and the NHS
Let’s take a look at how the virus cases have spread across the UK over the last 4 weeks. London has the highest number of cases in the UK, however the proportion of cases in London has come down steadily from 38% to 21% over the last 4 weeks. The North West is the next potential hot spot with the highest increase in the cases over the last 4 weeks – it has now overtaken the South East.

Data Source: UK Public health and the NHS
UK COVID-19 risk factors
Let’s take a closer look at the age-wise COVID-19 impact data for England. The data shows that 40% of the deaths are for the 60-79 age group while 52% of the deaths are for the 80+ age group. Unpredictably, the 40-59 age group in England appears to be doing better in comparison with Italy and New York.
| Age group | Proportion of deaths |
| 0 – 19 yrs | 0% |
| 20 – 39 | 1% |
| 40 – 59 | 8% |
| 60 – 79 | 40% |
| 80+ | 52% |
Data Source: UK Public health and the NHS
As seen in other countries, the ONS data shows that males in the UK are significantly more at risk than females with a death rate which is almost double that of females. This is very similar to the experience in Spain (7% versus 4%).
| Deaths involving COVID-19 | |
| Male | 113.1 |
| Female | 54.1 |
Data Source: ONS
11,677 total views