New York City COVID-19 death rate doubles in two weeks
As of 12th April 2020 the total COVID-19 cases in US were 557,590 while the total COVID-19 deaths numbered 22,109. The US now has more COVID-19 deaths than any country. New York is the current hotspot in the US and had 40% of the total cases as at 29th March 2020. Two weeks on and New York now has 33% of the total US cases. This means that the virus is spreading more widely across the US.
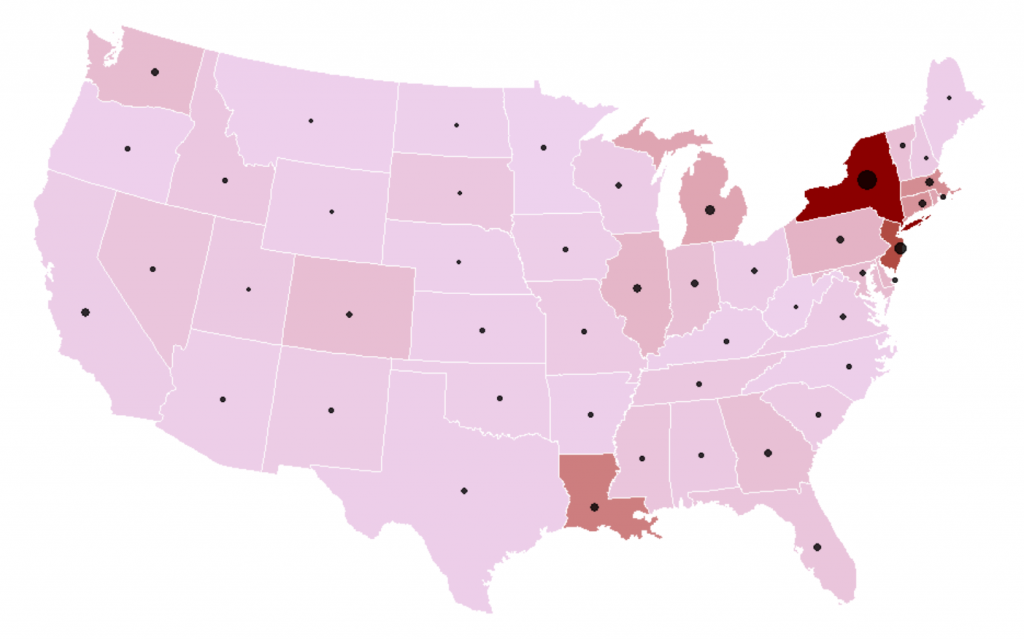
So, let’s take a closer look at a US COVID-19 heat map to see how the virus is spreading in the US. The heat map shows the ‘incidence’ (measured here as cases as a proportion of total state population) and deaths across the US as at the end of 12th April 2020. The darker the red colour the higher the virus incidence in the state; the larger the black dot the higher the number of deaths. There is an obvious cluster around New York. Further away Louisiana, Michigan, Washington, and Illinois are now taking on a darker hue suggesting that these might emerge as the next hotspots.

Source: State and county health departments
Let’s take a closer look at the COVID-19 related data for New York City and compare it with the situation two weeks ago on 29th March 2020. The data shows that currently 38% of the cases here are for the 18-44 age group and 36% for the 45-64 age group. This is similar to the data two weeks ago.
Worryingly, the hospitalisation rate is now higher for all age groups from two weeks ago (the numbers in brackets). Frighteningly, the current death rates have doubled over the two weeks – in fact the death rates for the 64+ age group is now almost the same as Italy.
| Age Group | Cases | Hospitalisation | Deaths | Deaths with underlying conditions | Death rate |
| 0-17 | 2% | 9% (10%) | 0% | 100% | 0% (0%) |
| 18-44 | 38% | 11% (9%) | 5% | 78% | 1% (0%) |
| 45-64 | 36% | 27% (22%) | 23% | 84% | 4% (2%) |
| 64-74 | 13% | 47% (36%) | 24% | 78% | 12% (5%) |
| 74+ | 11% | 60% (50%) | 47% | 72% | 26% (13%) |
| Female | 46% | 23% (18%) | 38% | 38% | 5% (2%) |
| Male | 54% | 29% (22%) | 62% | 62% | 7% (3%) |
Source: New York City Government
Now let’s look at the impact by boroughs. The hospitalisation rate has increased across all boroughs over the last two weeks (numbers in brackets) and is now close to what it was in the Bronx two weeks ago. The Bronx was ahead of the other boroughs two weeks ago and might be the one to watch going forward.
| Borough | Cases | Hospitalisation | Deaths |
| Bronx | 22% | 28% (26%) | 23% |
| Brooklyn | 26% | 26% (17%) | 28% |
| Manhattan | 13% | 27% (17%) | 11% |
| Queens | 31% | 28% (21%) | 32% |
| Staten Island | 8% | 16% (21%) | 5% |
Source: New York City Government
12,307 total views